Debugging
On a Browser
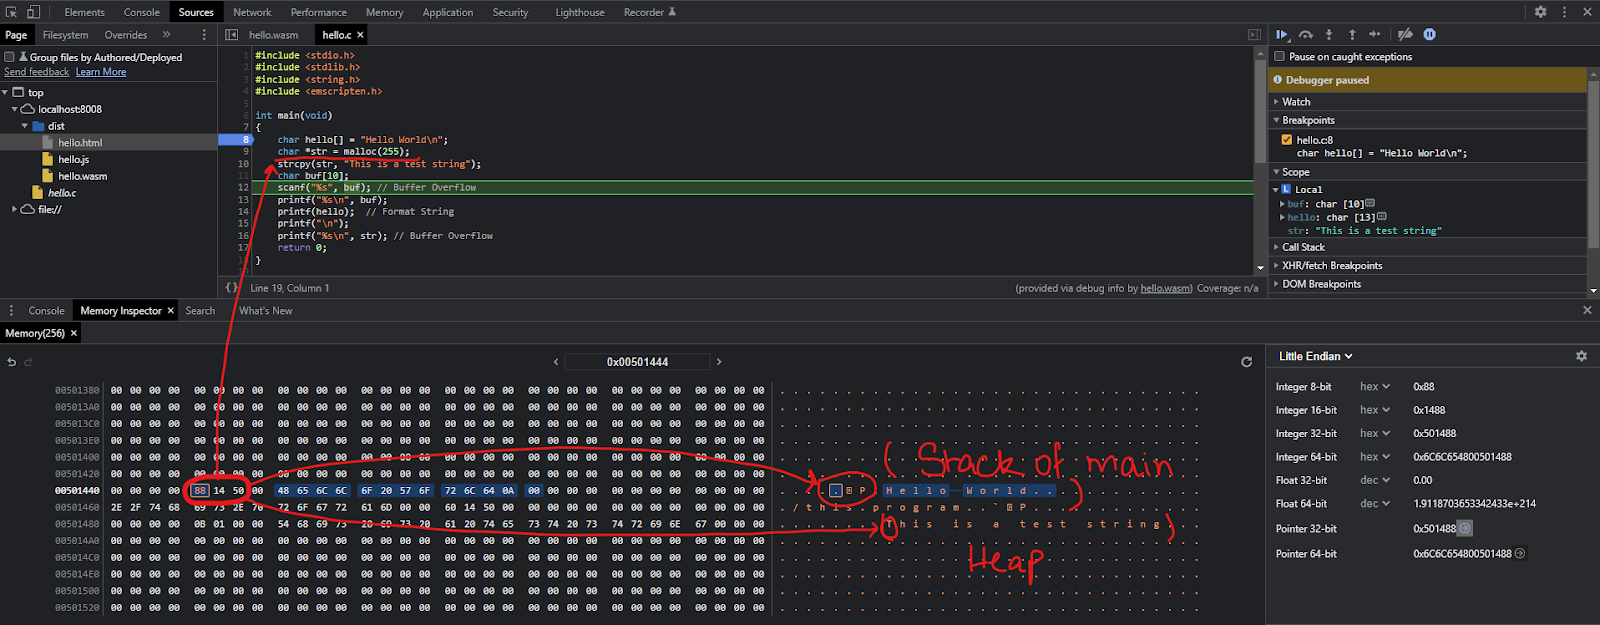
Using Chrome DevTools we can view the WAT representation and the C source of a WebAssembly Module. We can also set breakpoints and watch variables. Most importantly we can view the whole linear address space allocated for our WASM Instance.